The Pulsar Engineering

Today’s post will be relatively brief as I’m currently working on several other projects at the same time. Nonetheless, I wanted to share this with you since a long time :)
One of the main reasons I started working on Raman spectroscopy was the ability to actually observe what was going on during a reaction. Some folk told me one day that chemistry was all about faith: you mix two compounds and even if you don’t see anything you have to truly believe that something happened. This is no more true with Raman spectroscopy as you can really see the difference between reactants and products!
I’ve already shown how you can discriminate small amount of methanol in ethanol or how you can track the kinetic of a reaction. Today I will show how you can prove a reaction that exists on paper and where nothing seems to actually take place.
The reaction I will present today is the addition of sodium bisulfite to aldehydes and ketones. More exactly, I chose formaldehyde because I had some available. I will come back on this choice later.
The reaction mechanism is shown in Figure 1. The reaction is reversible using dilute acid which makes it very handy for purification purposes.
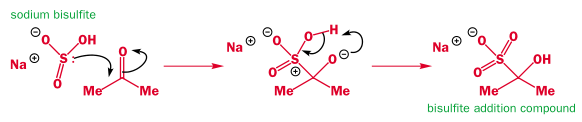
With Raman spectroscopy, you actually look at the geometrical structure of the various groups and bonds of the molecule. So you can see the carbonyl with its planar sp² structure connecting a carbon to an oxygen, the ending tetrahedral methyl groups or, after reaction, the new tetrahedral structure containing both a C-S bond and a C-OH bond. When you have a reaction like the one of Figure 1, you can therefore compare the spectra of the reactants (acetone and sodium bisulfite in Figure 1) with the spectrum of the product and you should be able to see the changing groups/bonds.
This is exactly what I did using formaldehyde and sodium bisulfite. I first recorded the spectra of the separate (pure) compounds and then the spectra of the mixture for comparison. The results are shown in Figure 2. I also tried to label the various peak to my best but please note that I don’t have a lot of experience in peak labelling and that the exercise is extremely difficult so don’t take it for granted! The labelling was done using previously annotated spectra of similar compounds (from Peter Larkin book on IR spectroscopy). Labelling is a dangerous exercise as you may be tempted to confirm you’re a priori expectations and miss the correct explanation… So please big care if you copy this to your own work/master thesis etc. I cannot stress it even more :)
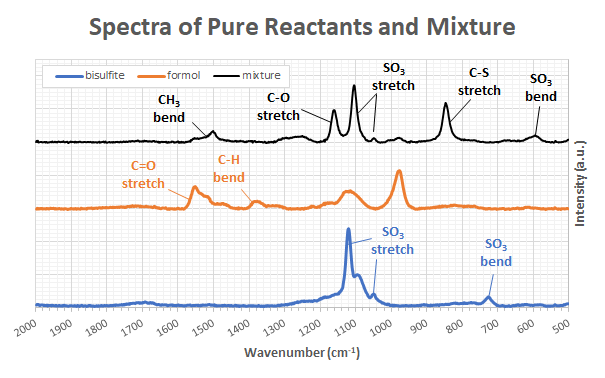
Several things can be noticed in Figure 2. First the carbonyl peak of the formaldehyde completely disappeared from the mixture. Second, C-O and C-S stretch peaks clearly appeared in the mixture as suggested by the theory. Among the weak peaks, we can notice the disappearance of the -CH2 aldehyde bend in profit to a CH3 bend which is also in agreement with the expectations and we also notice a displacement of the SO3 bend probably due to the proximity of the carbon centre. I was not able to explain the two unlabelled peaks from the formaldehyde despite my best efforts.
Retrospectively, choosing formaldehyde might not have been the smartest choice. I initially chose it because it would have very few peaks (it is a very simple molecule) which would ease my comparison since I don’t care about the peaks that do not change. On the other hand, formaldehyde is pretty reactive as it tends to decompose or react with itself in the presence of minute traces of impurities and my bottle was pretty old (although there should be a small bit of methanol into it to stabilize the solution).
Nonetheless, there is no doubt that a reaction took place since the spectra from the reactants differs so much from the spectrum of the mixture. And since most of the spectrum of formaldehyde is given by its carbonyl (recall that formaldehyde is basically just a carbonyl with two hydrogens), it means that the carbonyl disappeared in the mixture. Furthermore, the labelling seems to confirm the theory of the addition as represented in Figure 1. Even if the labelling was imprecise here, there is obviously no reason to doubt the reaction mechanism of Figure 1 as it a well-known reaction in organic chemistry. The aim of this post was of course not to prove any chemistry here but simply to illustrate how OpenRAMAN can help for these kind of tasks.
I will come back with or two more illustration like this one in the following weeks/months and after that I will start working back on the spectrometer itself to reduce its cost. I might also take the time to discuss more about a spare time activity that I started two years ago and for which I did not write anything yet… so stay tuned!
I would like to give a big thanks to James who has supported this post through Patreon. If you’d like to support me too and get credits as well as many other stuff, consider donating :) You can make the difference! I would also like to thanks Philippe who assisted me with this reaction during Christmas!