The Pulsar Engineering
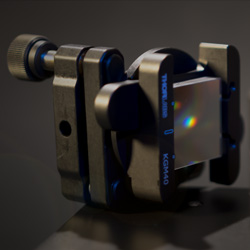

One effect that I did not discuss yet in spectrographs is the slit compression effect. Up to now, I assumed in my posts that the image of the slit had the same size as the physical slit (provided that the same focal lengths are used for imaging) but reality is a bit different. I will derive the effect here for a diffraction grating.
The equation for the diffraction grating is

where m is the diffraction order, λ the wavelength, G the groove density and θin/θout the input and output angles.
Because our slit is not a point source, it subtends an half angle ∆θ that is given by half of the size of the slit and the focal length of the optics used. What I will show here is that the output subtended angle is not equal to the input subtended angle.
We can rewrite our grating equation for the ray corresponding to the edge of the slit

We should now express ∆θout as a function of ∆θin.
Let’s split the sine terms using a Taylor series expansion around θin and θout

and therefore

By subtracting the initial grating equation

and we finally get
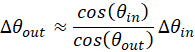
The input slit therefore appears magnified by a term cos(θin)/cos(θout) which is 1 only in the Littrow condition (θin=θout). When θin>θout the slit appears smaller than its real size and when θin<θout the slit appears larger than its real size.
In the Raman spectroscopy setup, the compression is about 0.7× smaller than the physical size so a slit of 20 µm will appear as it if were 14 µm.
You may want to take this into account when designing your own spectrographs.