The Pulsar Engineering

Last week I briefly discussed the slit compression effect that was affecting spectrometer design and performances. Today, I will discuss another effect in spectrographs which is slit distortion.
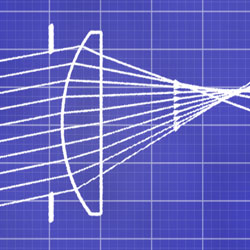
When we plot the chief rays traversing a spectrograph for a slit at various discrete wavelengths, we obtain a plot like Figure 1. Please note that this is the actual raytracing for the spectroscope I have designed earlier. Axis are given in millimetres.
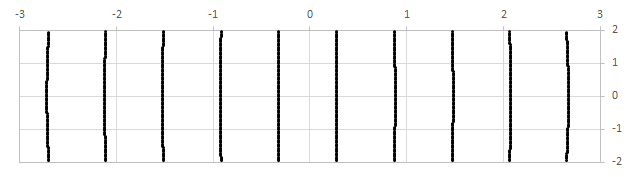
We can see that outer wavelengths have a moderate to strong distortion whereas wavelengths near the centre are almost straights. A close-up of the edge of the sensor is given in Figure 2.
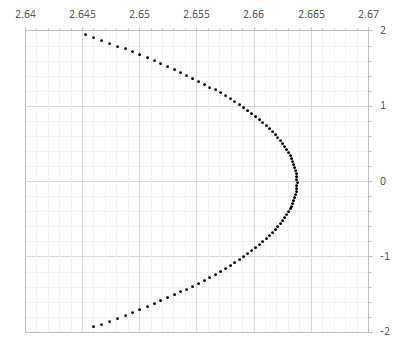
The effect clearly amplifies with the slit height as can be seen in the dot density. It is less than 2 µm for 1 mm slits, 5 µm for 2 mm slits, 12 µm for 3 mm slits and up to 20 µm for 4 mm slits.
If you process the spectra by summing vertically the columns to increase the SNR, you will suffer from a loss of resolution due to the distorted slit being imaged on several pixels.
I have computed this effect and displayed the result as an histogram in Figure 3 for a slit of 3 mm height (typical slit height at Thorlabs) and 3.45 µm pixels (pixel size of the camera I used in the spectrometer).
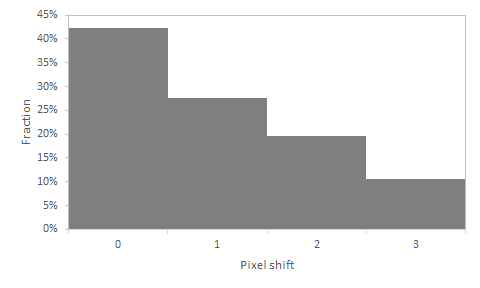
Most of the energy is spread on two pixels and you will have to reduce the slit to 2 mm to concentrate enough energy on the nominal pixel and reduce to 1 mm to completely remove the effect. If you have respected the golden rule of at-least 3 pixel for resolution of your spectrometer and that you are precisely working at the spectrometer limits, this effect can reduce your spectrometer performances by about 70% unless you either use a better algorithm for the sum or use a smaller slit size.
Please note that this effect is not present in our Raman spectrometer since we do not use the full height of the slit due to the laser focalisation in one tight spot.